Mabuhay!
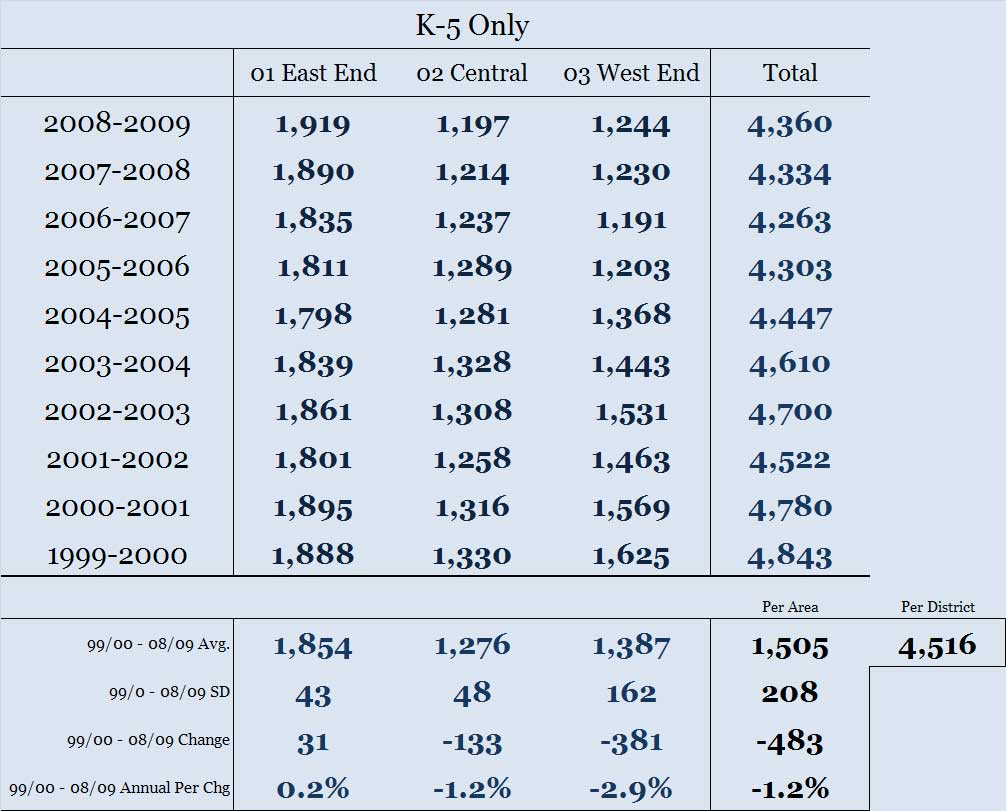
Here are elementary school enrollment data I
recently compiled. Last school year (2008/2009),
there were 4,360 K-5 elementary students in
Alameda, 483 less than number in 1999/2000, or
4,843 (see Table 1).
Of the 4,360 elementary students, 1,919 (44 percent)
attended public schools in the East End, 1,197 (27
percent) were in Central Alameda, and 1,244 (29
percent) attended West End schools.
Over the long-term 2000-2009 period, on average,
there were 1,854 elementary students a year in the
East End, 1,276 in Central Alameda, and 1,387 in the
West End.
What is interesting about each area's long-term
annual average is their respective standard
deviation, a rudimentary statistical measure of
volatility around an average. While over the
2000-2009 period East End elementary schools
averaged 1,854 K-5 students per year, the standard
deviation for this area was relatively stable at 43,
meaning that the population more or less ranged
between 1,811 and 1,897, all the while averaging
1,854. Central Alameda exhibited a similarly stable
standard deviation.
West End enrollment trends depict a different story.
Of the overall district-wide decline of 483 elementary
kids between 2000 and 2009, the bulk occurred in the
West End, where K-5 enrollment dropped by 381
between 2000 and 2009. This decline statistically
expresses itself in another way -- in the form of a
relatively high standard deviation of 162, which is
approximately four times greater than the standard
deviation of the other areas.
While on average there have been more kids in the
West End compared to Central Alameda, K-5
population in Central Alameda between 2000 and
2009 have generally been more stable than in the
West End.
School-By-School Trends
The section above discussed broad enrollment
trends by areas in Alameda. Below, we discuss
enrollment trends on a school-by-school basis.
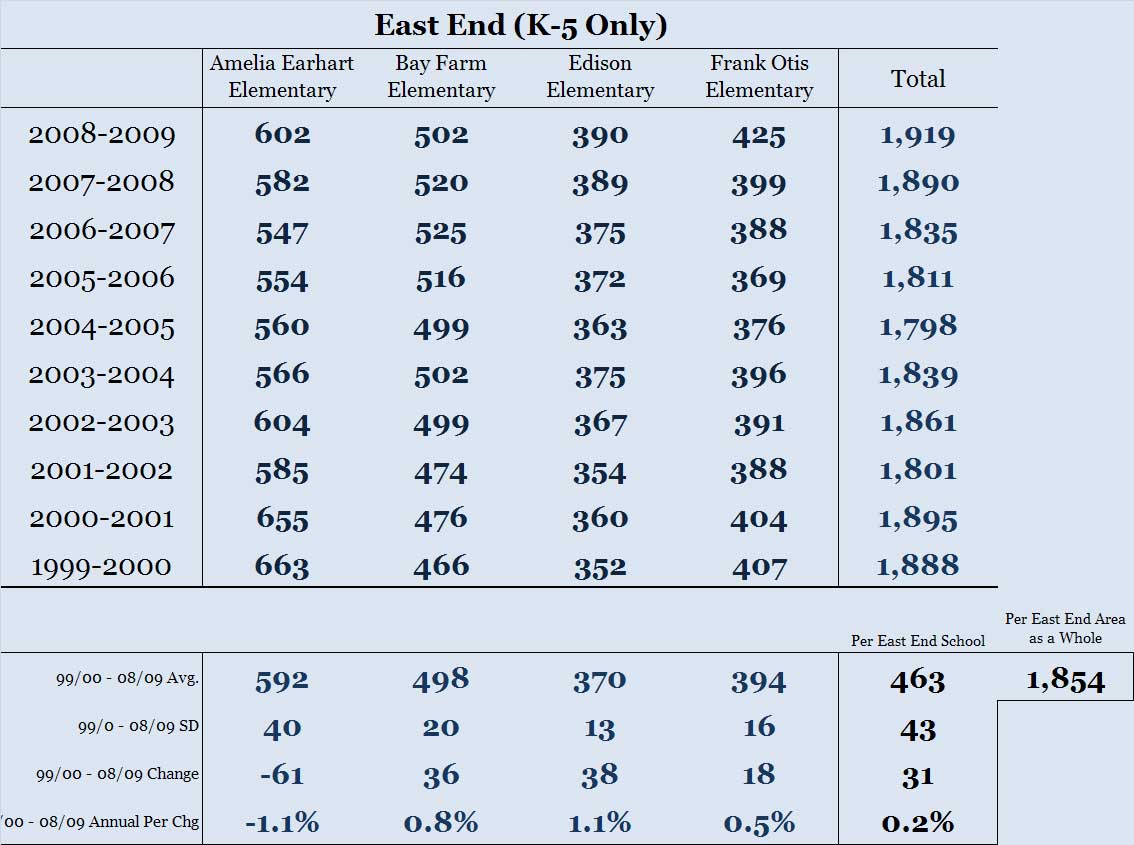
Table 2 presents data on specific elementary
schools in the East End. Of the 1,919 K-5 students in
2008/2009, 602 (31 percent) attended Amelia Earhart,
502 (26 percent) Bay Farm, 390 (20 percent) Edison,
and 425 Otis (22 percent).
The table also shows the long-term average annual
number of K-5 students attending each school.
Between 2000 and 2009, on average 592 students a
year attended Earhart Elementary and an average of
498 attended Bay Farm each year between 2000 and
2009. The long-term annual enrollment average for
Edison and Otis was 370 and 394 respectively.
Both Edison and Otis exhibited strikingly low
standard deviations of 13 and 16 relative to the East
End's already low standard deviation of 43. Between
2000 and 2009, the number of students attending
Edison ranged between 357 and 383, all the while
averaging 370.
Thus, while East End K-5 schools generally are
stable with respect to enrollment, Edison and Otis
particularly exhibit very little enrollment slack,
indicative of greater than usual demand for these
schools.
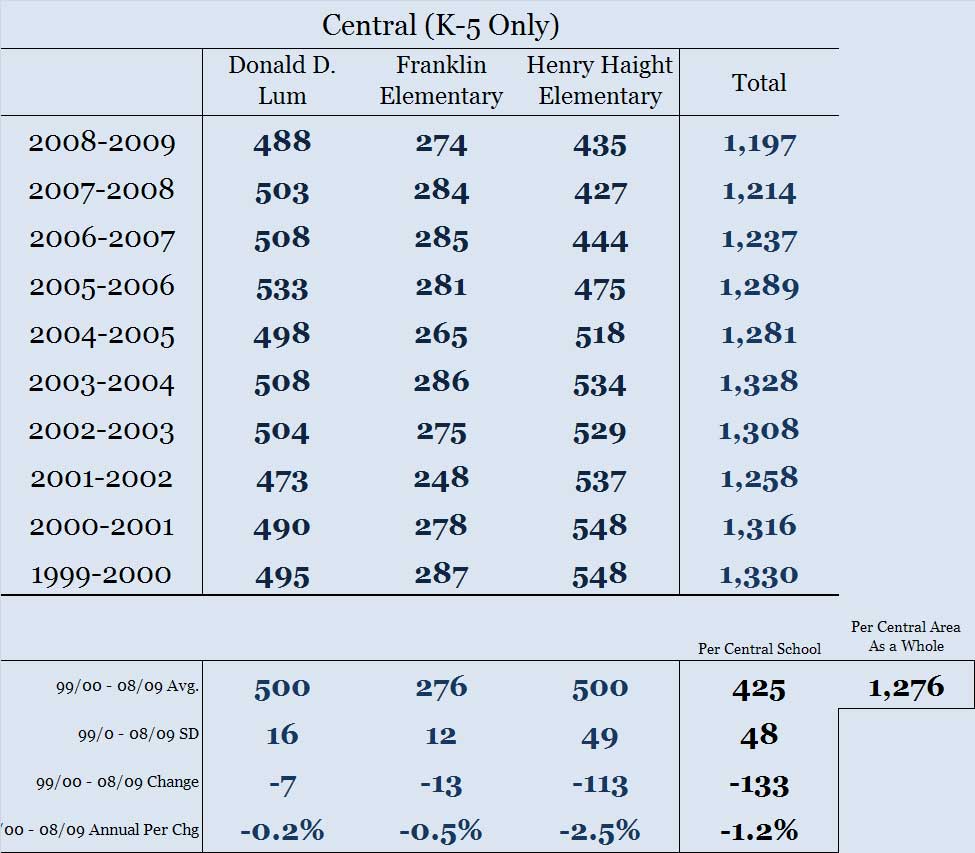
Table 3 tracks K-5 enrollment trends for Central
Alameda schools. Over the nine-year 2000-2009
period, Lum and Haight Schools respectively
averaged 500 students each year, with Franklin
Elementary averaging 276 K-5 students a year.
Similar to Edison in the East End, with a relatively
low standard deviation of 12, Franklin's greater than
usual enrollment stability is illustrative of a premium
placed on this school and neighborhood by parents
of school-age children. Year-in, year-out, the number
of kids attending Franklin oscillated by a factor of
plus/minus 12 all the while averaging 276.
While larger than Franklin (274 K-5 students in
2008/2009) in terms of number of students, Haight
Elementary's (435 K-5 students) long-term standard
deviation is almost four times Franklin's, at 49,
meaning greater enrollment fluctuation at this school
relative to Franklin or Lum. It's also worth noting that
at 49 Haight's standard deviation is only slightly
higher than the 2000-2009 volatility index for the East
End as a whole (43). As it is, Haight's enrollment has
been trending downward annually since 1999/2000.
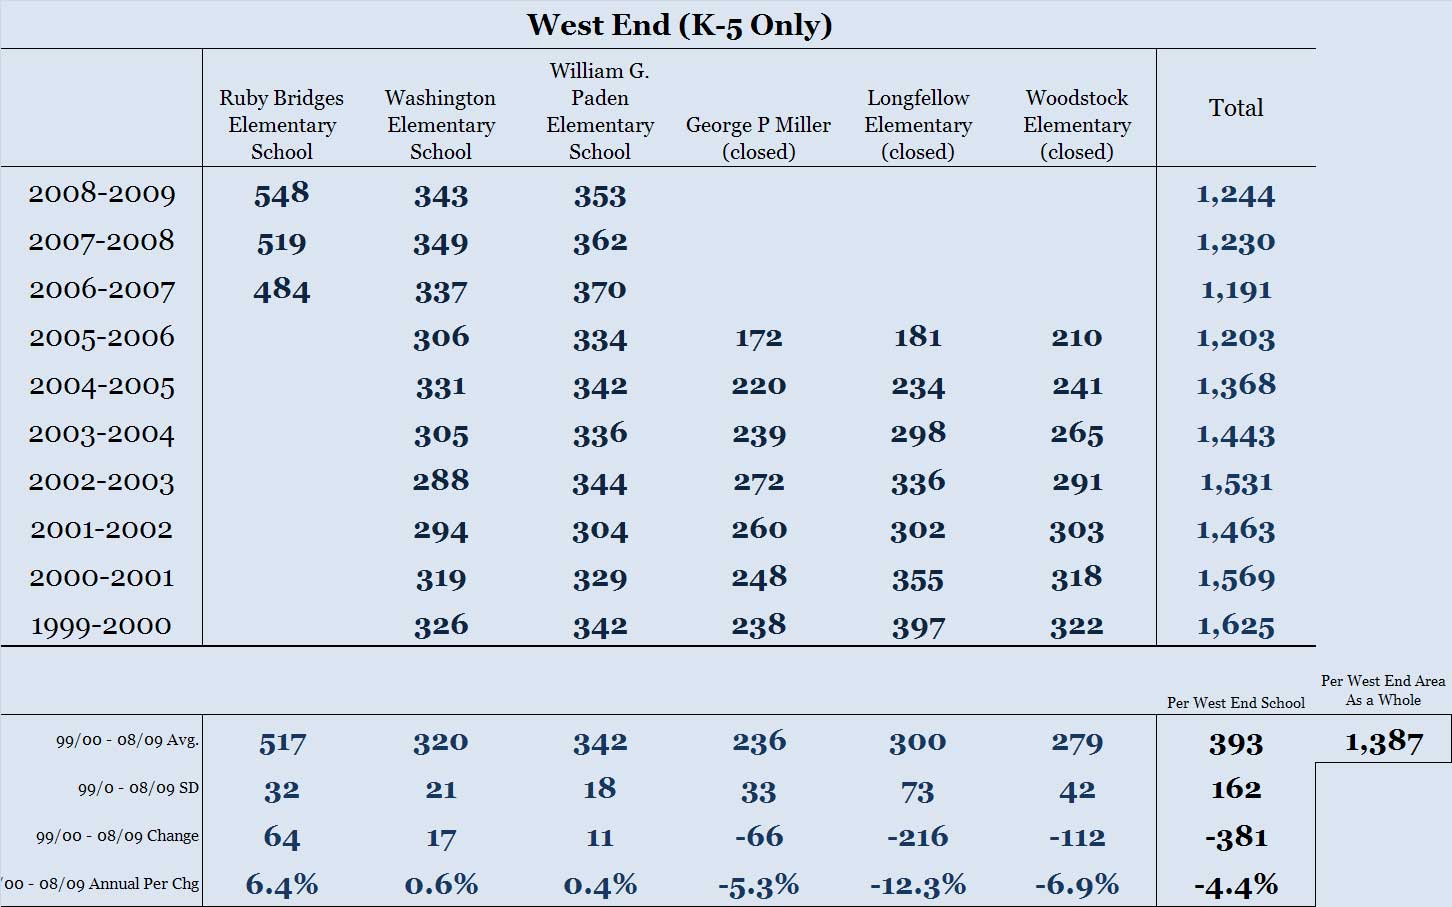
There are three public elementary schools in
Alameda's West End. These are the relatively new
Ruby Bridges, Washington, and Paden Elementary
Schools. (I attended Paden Elementary in the 1970s).
There were 1,244 K-5 students in the West End in
2008/2009 (see Table 4). Of this, 548 (44 percent)
were at Ruby Bridges, 343 (28 percent) at
Washington, and 353 (28 percent) at Paden.
Over the long-term 2000-2009 period, Washington
and Paden annually averaged 320 and 342 students
respectively, all the while exhibiting a solid standard
deviation of 21 and 18 for this nine-year period.
These schools are relatively stable with respect to
enrollment, as is Ruby Bridges.
In addition to Ruby Bridges, Washington, and Paden
Elementary Schools, there are three sites in the West
End that once operated as elementary schools.
The West End's relatively high long-term standard
deviation of 162 is attributable largely to fluctuations
occurring between 2000 and 2006 at the now-closed
George P. Miller, Longfellow, and Woodstock
Elementary Schools.
Between 2000 and 2006, enrollment in the three
now-shuttered elementary schools declined from a
combined 957 to 563 K-5 students. Over this six-year
period, these schools combined averaged 815
students a year, all the while exhibiting a standard
deviation of 141, meaning that population fluctuated
widely (and downward) between 674 and 955 kids.
For each year since 2006, there have been 1,191
(2006/2007), 1,230 (2007/2008), and 1,244 (2008/2009)
K-5 students attending Ruby Bridges, Washington,
and Paden Elementary Schools combined. (Kids
who once attended Woodstock and Longfellow
mostly transferred to Ruby Bridges). Over the
three-year 2006-2009 period, the remaining three
schools combined averaged 1,222 students a year,
with a relatively healthy standard deviation of 27.
While over the long-term between 2000 and 2009,
West End elementary schools exhibited a high
standard deviation of 162 indicative of demographic
instability, things are now beginning to stabilize,
judging by the lower standard deviation figure of 27
for the three-year period between 2006 and 2009.
However, it is important to note that, at 1,244 K-5
students, there are still significantly less number of
elementary students in the West End now compared
to nine years ago in 1999-2000, when there were
1,625 K-5 students.
Data come from California Department of Education.
By Tony Daysog
recently compiled. Last school year (2008/2009),
there were 4,360 K-5 elementary students in
Alameda, 483 less than number in 1999/2000, or
4,843 (see Table 1).
Of the 4,360 elementary students, 1,919 (44 percent)
attended public schools in the East End, 1,197 (27
percent) were in Central Alameda, and 1,244 (29
percent) attended West End schools.
Over the long-term 2000-2009 period, on average,
there were 1,854 elementary students a year in the
East End, 1,276 in Central Alameda, and 1,387 in the
West End.
What is interesting about each area's long-term
annual average is their respective standard
deviation, a rudimentary statistical measure of
volatility around an average. While over the
2000-2009 period East End elementary schools
averaged 1,854 K-5 students per year, the standard
deviation for this area was relatively stable at 43,
meaning that the population more or less ranged
between 1,811 and 1,897, all the while averaging
1,854. Central Alameda exhibited a similarly stable
standard deviation.
West End enrollment trends depict a different story.
Of the overall district-wide decline of 483 elementary
kids between 2000 and 2009, the bulk occurred in the
West End, where K-5 enrollment dropped by 381
between 2000 and 2009. This decline statistically
expresses itself in another way -- in the form of a
relatively high standard deviation of 162, which is
approximately four times greater than the standard
deviation of the other areas.
While on average there have been more kids in the
West End compared to Central Alameda, K-5
population in Central Alameda between 2000 and
2009 have generally been more stable than in the
West End.
School-By-School Trends
The section above discussed broad enrollment
trends by areas in Alameda. Below, we discuss
enrollment trends on a school-by-school basis.
Table 2 presents data on specific elementary
schools in the East End. Of the 1,919 K-5 students in
2008/2009, 602 (31 percent) attended Amelia Earhart,
502 (26 percent) Bay Farm, 390 (20 percent) Edison,
and 425 Otis (22 percent).
The table also shows the long-term average annual
number of K-5 students attending each school.
Between 2000 and 2009, on average 592 students a
year attended Earhart Elementary and an average of
498 attended Bay Farm each year between 2000 and
2009. The long-term annual enrollment average for
Edison and Otis was 370 and 394 respectively.
Both Edison and Otis exhibited strikingly low
standard deviations of 13 and 16 relative to the East
End's already low standard deviation of 43. Between
2000 and 2009, the number of students attending
Edison ranged between 357 and 383, all the while
averaging 370.
Thus, while East End K-5 schools generally are
stable with respect to enrollment, Edison and Otis
particularly exhibit very little enrollment slack,
indicative of greater than usual demand for these
schools.
Table 3 tracks K-5 enrollment trends for Central
Alameda schools. Over the nine-year 2000-2009
period, Lum and Haight Schools respectively
averaged 500 students each year, with Franklin
Elementary averaging 276 K-5 students a year.
Similar to Edison in the East End, with a relatively
low standard deviation of 12, Franklin's greater than
usual enrollment stability is illustrative of a premium
placed on this school and neighborhood by parents
of school-age children. Year-in, year-out, the number
of kids attending Franklin oscillated by a factor of
plus/minus 12 all the while averaging 276.
While larger than Franklin (274 K-5 students in
2008/2009) in terms of number of students, Haight
Elementary's (435 K-5 students) long-term standard
deviation is almost four times Franklin's, at 49,
meaning greater enrollment fluctuation at this school
relative to Franklin or Lum. It's also worth noting that
at 49 Haight's standard deviation is only slightly
higher than the 2000-2009 volatility index for the East
End as a whole (43). As it is, Haight's enrollment has
been trending downward annually since 1999/2000.
There are three public elementary schools in
Alameda's West End. These are the relatively new
Ruby Bridges, Washington, and Paden Elementary
Schools. (I attended Paden Elementary in the 1970s).
There were 1,244 K-5 students in the West End in
2008/2009 (see Table 4). Of this, 548 (44 percent)
were at Ruby Bridges, 343 (28 percent) at
Washington, and 353 (28 percent) at Paden.
Over the long-term 2000-2009 period, Washington
and Paden annually averaged 320 and 342 students
respectively, all the while exhibiting a solid standard
deviation of 21 and 18 for this nine-year period.
These schools are relatively stable with respect to
enrollment, as is Ruby Bridges.
In addition to Ruby Bridges, Washington, and Paden
Elementary Schools, there are three sites in the West
End that once operated as elementary schools.
The West End's relatively high long-term standard
deviation of 162 is attributable largely to fluctuations
occurring between 2000 and 2006 at the now-closed
George P. Miller, Longfellow, and Woodstock
Elementary Schools.
Between 2000 and 2006, enrollment in the three
now-shuttered elementary schools declined from a
combined 957 to 563 K-5 students. Over this six-year
period, these schools combined averaged 815
students a year, all the while exhibiting a standard
deviation of 141, meaning that population fluctuated
widely (and downward) between 674 and 955 kids.
For each year since 2006, there have been 1,191
(2006/2007), 1,230 (2007/2008), and 1,244 (2008/2009)
K-5 students attending Ruby Bridges, Washington,
and Paden Elementary Schools combined. (Kids
who once attended Woodstock and Longfellow
mostly transferred to Ruby Bridges). Over the
three-year 2006-2009 period, the remaining three
schools combined averaged 1,222 students a year,
with a relatively healthy standard deviation of 27.
While over the long-term between 2000 and 2009,
West End elementary schools exhibited a high
standard deviation of 162 indicative of demographic
instability, things are now beginning to stabilize,
judging by the lower standard deviation figure of 27
for the three-year period between 2006 and 2009.
However, it is important to note that, at 1,244 K-5
students, there are still significantly less number of
elementary students in the West End now compared
to nine years ago in 1999-2000, when there were
1,625 K-5 students.
Data come from California Department of Education.
By Tony Daysog
11.02.2009
This site is about making the West End of Alameda an even better place for everyone . . .
alamedans.com
blogging bayport
alameda daily news
the island
action alameda
94501 real estate
mike mcmahon ausd
sf chron 'meda blog
alameda journal
alameda sun
blogging bayport
alameda daily news
the island
action alameda
94501 real estate
mike mcmahon ausd
sf chron 'meda blog
alameda journal
alameda sun
local links
quick links
| |
| |
| |
| Copyright 2009 Tony Daysog, all rights reserved |
| Table 1 K-5 Enrollment Trends By Area 2000-2009 |
| Table 2 K-5 Trends: East End 2000-2009 |
| Table 3 K-5 Trends: Central Area 2000-2009 |
| Table 4 K-5 Trends: West End 2000-2009 |